
If you manage a sim racing team, you will likely find yourself tracking all sorts of interesting data in an attempt to gain competitive advantage. In addition to tracking fastest and average lap times across various track and car conditions, I find it quite useful to keep an eye on drivers’ iRacing iRating and Safety Rating to estimate what split we are likely to find ourselves driving in for any given event. For endurance events, splits are determined based on the average iRating of the declared drivers for each team.
iRacing Terminology
iRating – a measure of a driver’s skill level and performance relative to other competitors and can range from 0 to over 10000, with higher iRatings indicating stronger drivers.
Safety Rating – a metric that reflects a driver’s ability to navigate races cleanly and without incidents, and is measured on a scale from 0.00 to 4.99, with higher values indicating safer driving habits.
Split – a division of players based on their iRating to create a balance of competitiveness and fairness among race participants, and preventing overcrowding on the track.
Tracking individual driver statistics along with aggregating and averaging them across the entire team using Google Sheets is pretty straight-forward, and might look like this:
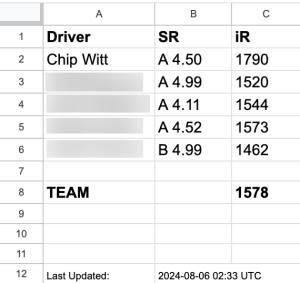
Manually managing the collection and entry of this data is not difficult, but it is also a task perfectly suited for automation, so that is my preference.
How It Used to Work
Many have used iRacing’s web user interface to find various statistics needed and then written scripts to “scrape” data from those resulting pages to work with it elsewhere. While this would have been a viable option to start, iRacing provided links to comma-separated value files containing driver statistics for each of the core driving categories on the service, aggregating and updating them regularly throughout the day, to make gathering and using data a little more approachable. The files (which are no longer accessible) were:
https://ir-data-now.s3.amazonaws.com/csv/Oval_driver_stats.csv
https://ir-data-now.s3.amazonaws.com/csv/Sports_Car_driver_stats.csv
https://ir-data-now.s3.amazonaws.com/csv/Formula_Car_driver_stats.csv
https://ir-data-now.s3.amazonaws.com/csv/Road_driver_stats.cs
https://ir-data-now.s3.amazonaws.com/csv/Dirt_Oval_driver_stats.csv
https://ir-data-now.s3.amazonaws.com/csv/Dirt_Road_driver_stats.csv
Tech Terminology
Python – a computer programming language often used to build websites and software, automate tasks, and analyze data.
Pandas – a Python library used for working with data sets. It has functions for analyzing, cleaning, exploring, and manipulating data. The name “Pandas” has a reference to both “Panel Data”, and “Python Data Analysis”.
Dataframe – a data structure constructed with rows and columns, similar to a database or Excel spreadsheet.
API – or Application Programming Interface, acts as the language that allows different software applications to talk to one another.
API Wrapper – a set of programming instructions that acts as a layer between an application and an API, simplifying interactions between the two.
JSON – or JavaScript Object Notation, is a text-based format for storing and exchanging data that can be read by humans and understood by computers.
Grabbing the data I needed from the appropriate CSV file and writing it into a Pandas dataframe was quite easy using Python:
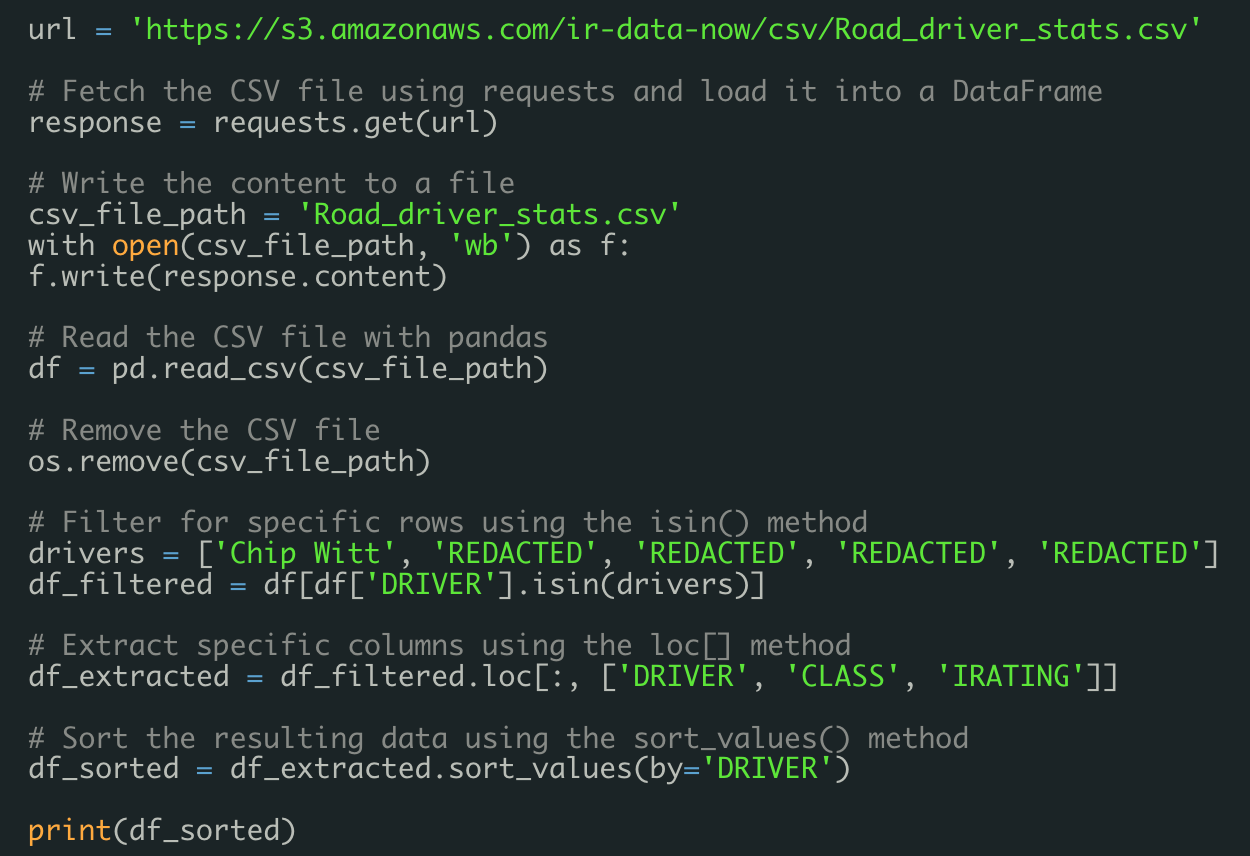
The resulting dataframe could then be easily written to a Google Sheet. Setting up this script to automatically run each time my sim rig PC started kept the information in the spreadsheet up-to-date and immediately accessible when needed.
That is, until July 8, 2024, when iRacing permanently shutdown their legacy web UI and removed access to the CSV files, leaving the new iRacing /data API as the only path to driver statistics. This required a new approach and an updated script.
The New Way
APIs are extremely useful, but can sometimes be tedious to code against directly. For that reason, I tend to look for wrappers that make accessing the API a tad easier, and make the code I write to get the job done more readable. Luckily, iracingdataapi (https://github.com/jasondilworth56/iracingdataapi) for Python is a well-maintained wrapper for iRacing’s new /data API.
API Authentication and Initiation
Before you can begin to use the API, you first need to authenticate. For automation tasks, you need to be mindful of security implications of your code, because, in most cases, the script performing the automated tasks will be acting as your proxy with your credentials. This means it is important to avoid hard-coding those credentials within the script where anyone with access to it can read them, and doing other silly things that deviate from secure software coding best practices. It is also important to take care that the script can’t “run-away” and do unintended things, making testing (both, happy and sad paths) a critical part of your work.
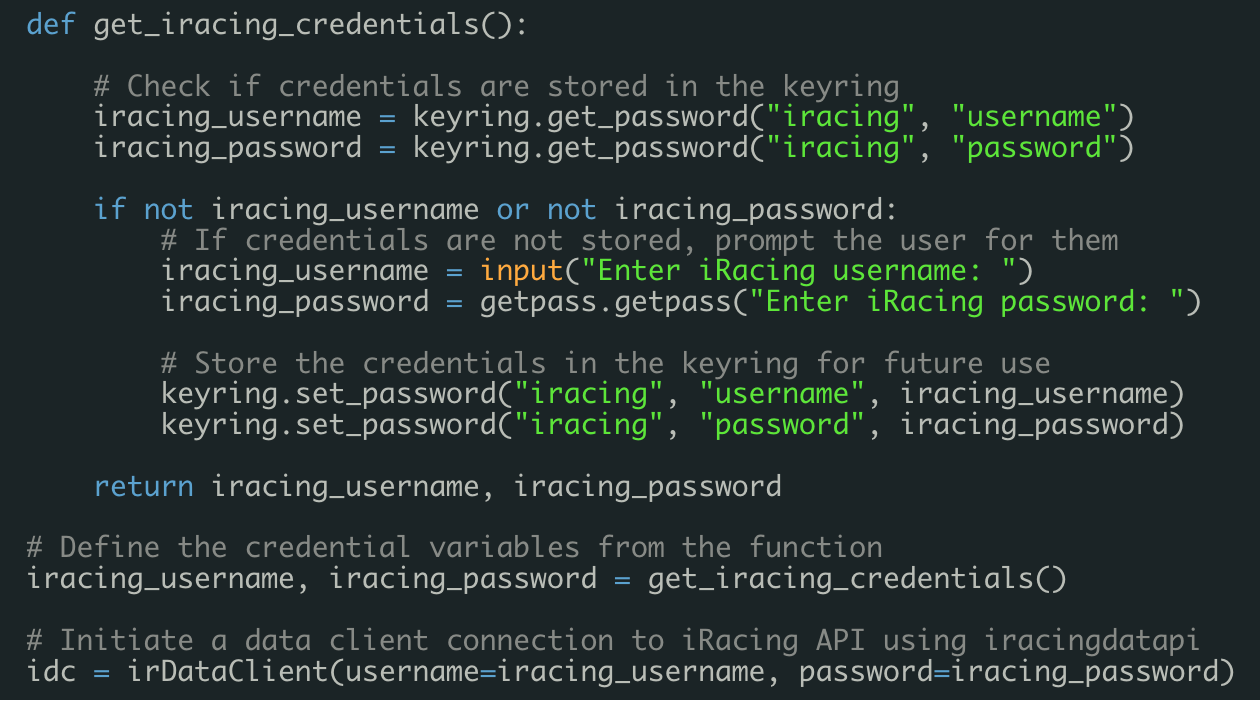
To authenticate, I chose to leverage the keychain and getpass Python modules to check to see if the needed credentials are already present in the logged-in user’s keychain (a reasonably secure credential facility, variations of which are built-in to MacOS, Windows, and Linux operating systems), and if they are not, collect them from the user at the command-line and store them securely in the keychain for future use (demanding the script be run at least once manually to collect the necessary credentials before scheduling the automated, on-going running of it). Once the credentials are available, the code initiates a connection to the API that will be used for making data calls throughout the remainder of the script. The process looks like this:
Note
With the 2024 iRacing Season 3 release, new /data/driver_stats_by_category endpoints were made available for downloading CSV versions of the driver stats previously available as CSVs on the membersite. The iracingdataapi wrapper for Python was supposed to have support for these new endpoints as of version 1.2.1, but it was not present when I updated to that version. Instead, I accessed the driver stats I required using a different endpoint that was already supported by the wrapper.
Preparing to Collect Driver Statistics
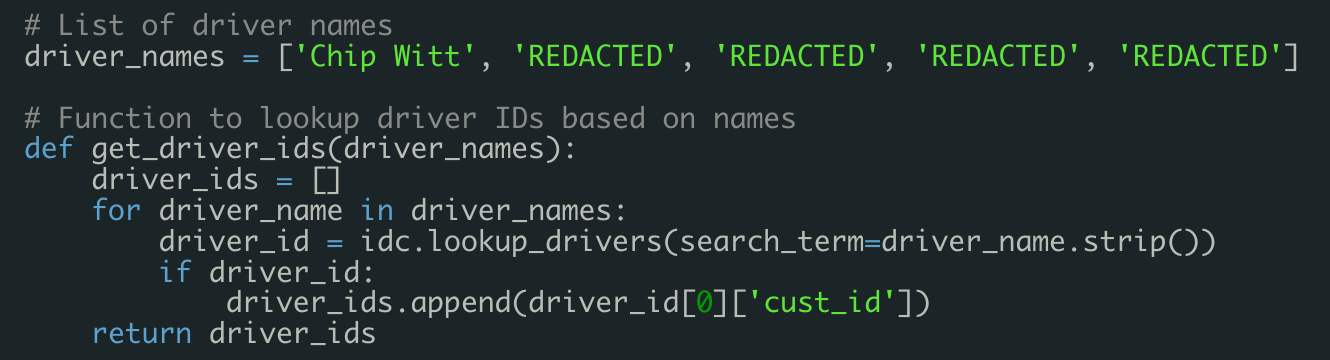
Before we can collect statistics for individual drivers, we need to do a little work to identify each driver’s customer_id on the iRacing service by querying the /data/lookup/drivers endpoint with their name (the name must be the Display Name registered with iRacing). We accomplish this by way of a call to lookup_drivers through our wrapper client connection:
After exploring the iRacing API, I found the /data/member/chart_data endpoint had exactly what I needed for collecting iRating and Safety Rating information for my drivers, and is made accessible through member_chart_data call using the wrapper. The comments documenting the function in the wrapper help us understand how to call it and what it will return:

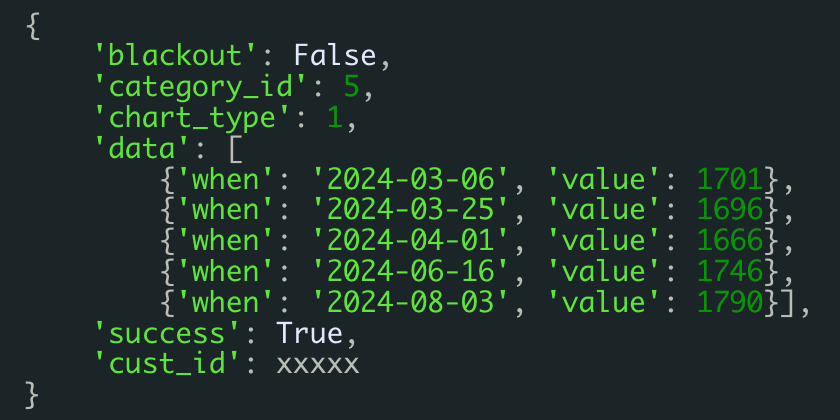
A call to category_id=5, chart_type=1 for each driver grabs the iRating information, and a call to category_id=5, chart_type=3 gets the Safety Rating information. Respectively, the returned JSON looks like this:
…and:
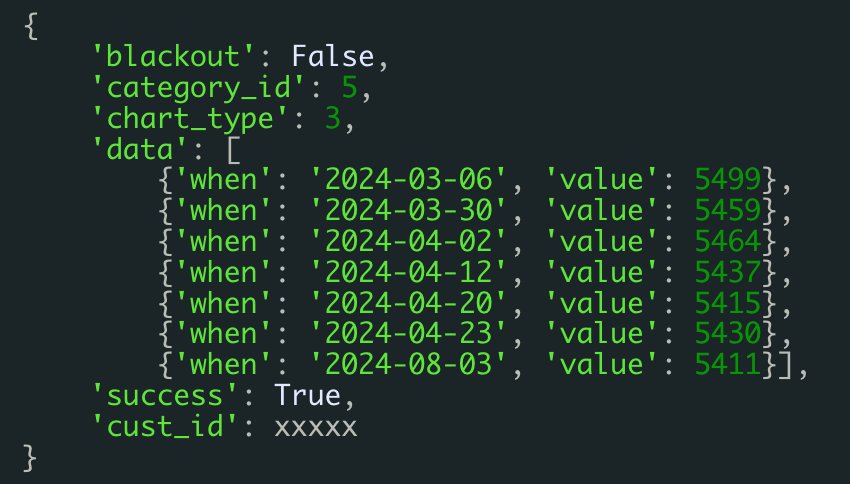
The iRating JSON series is pretty straight-forward. The value is the iRating for the driver at the date specified by when. For my purposes, I am only interested in the last data value (the current iRating), so I will just grab that. The Safety Rating data requires a little bit more decoding to use; ultimately, I was able to deduce that the first digit in the returned value was a numeric representation of the driver’s license class. Mapping that out:
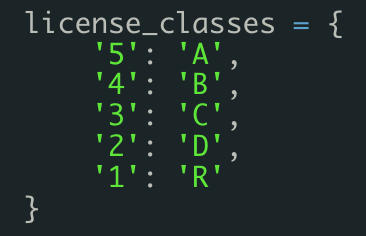
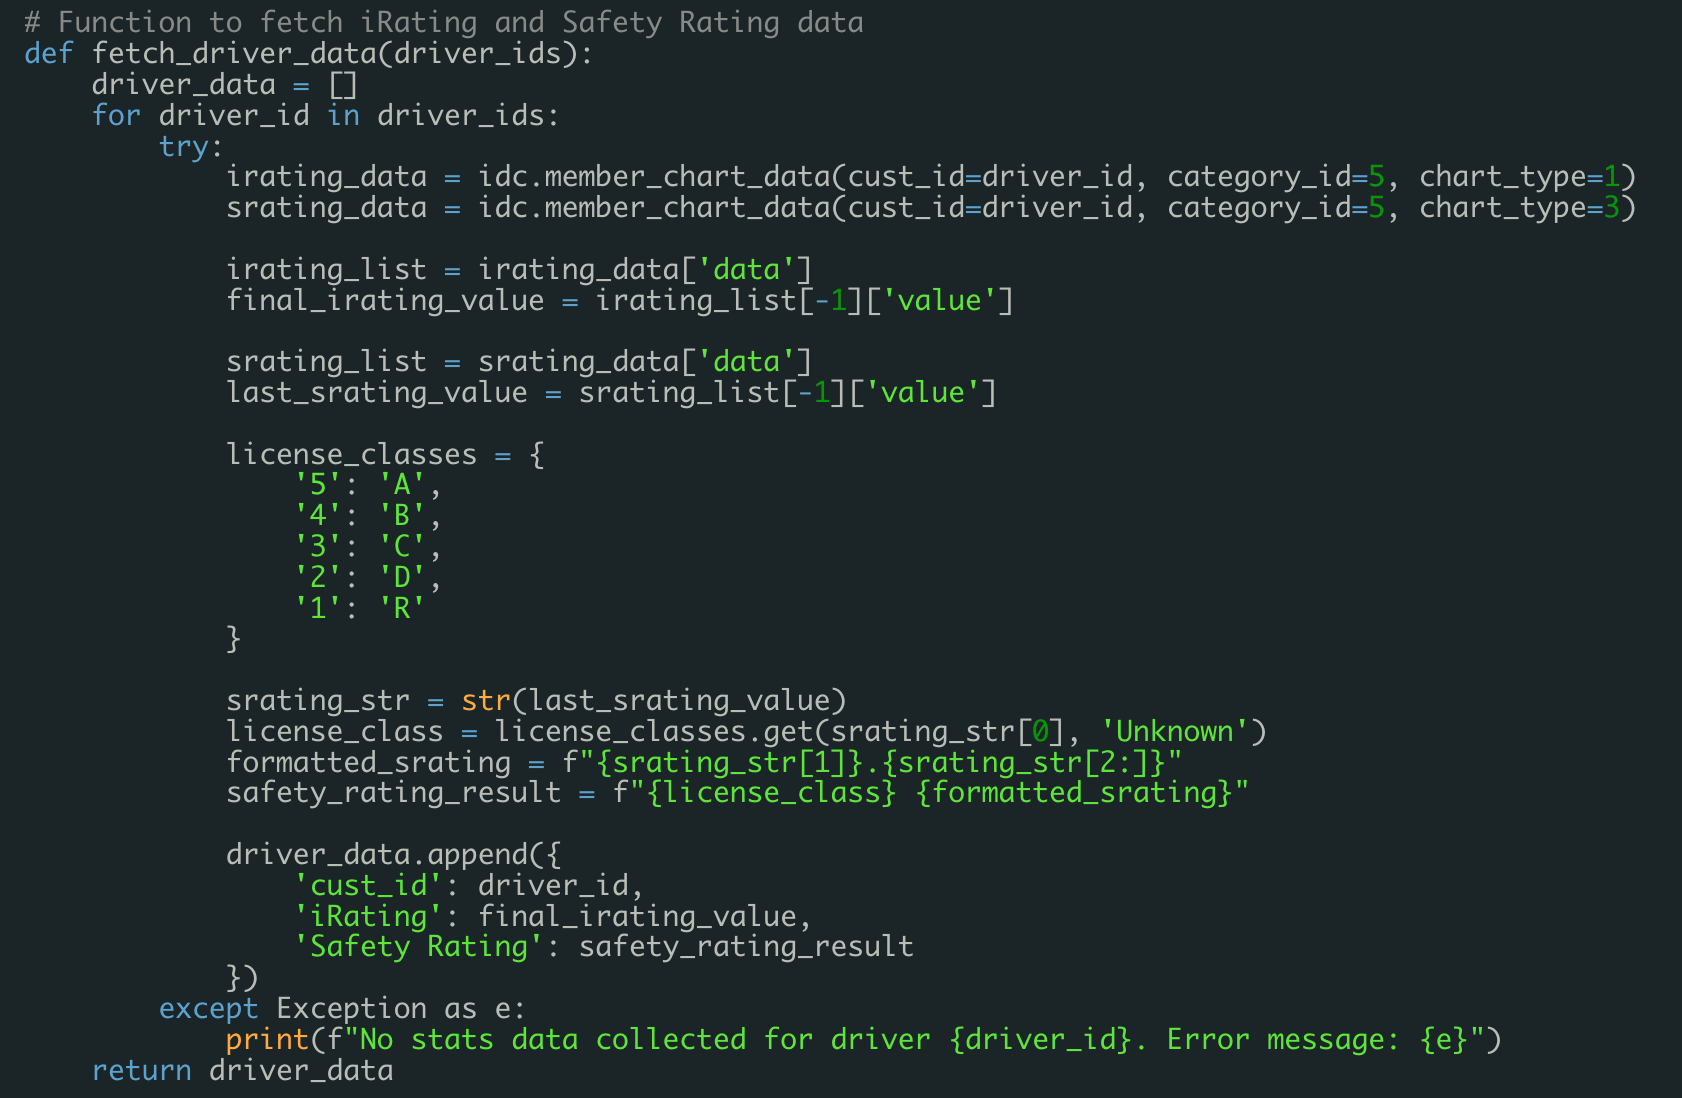
The remaining digits represent the decimal Safety Rating value, but are lacking the expected decimal point. In the example JSON above, the value ‘5411’ becomes ‘A 4.11’. Again, I’m only interested in the last value in the returned set, so the function to collect and transform the data in preparation for writing it to the dataframe becomes:
Collecting, Organizing, and Writing Data to the Dataframe
Consolidating the above work, writing the data to a dataframe just requires that we call the functions and do a little bit of reorganization of the returned data:
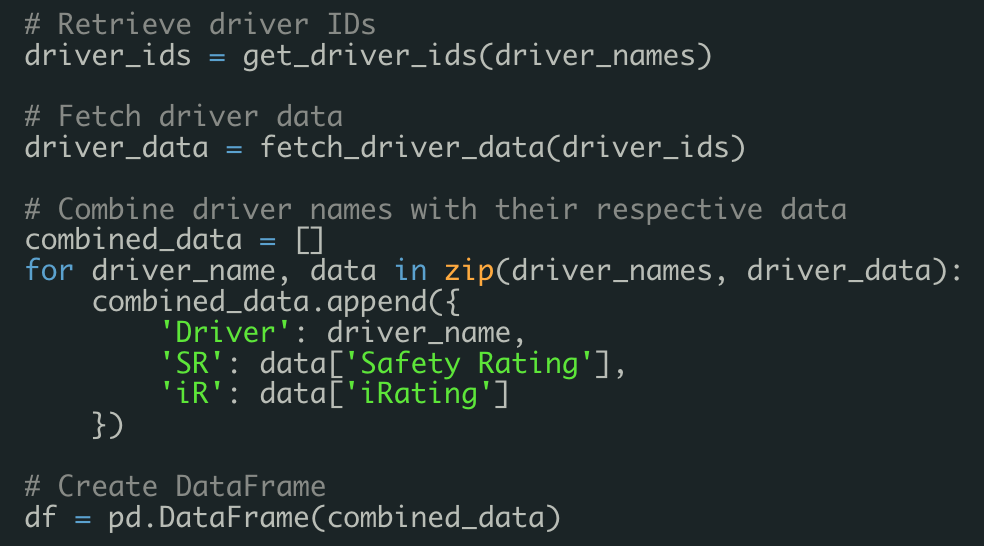
Publishing the Data to a Google Sheet
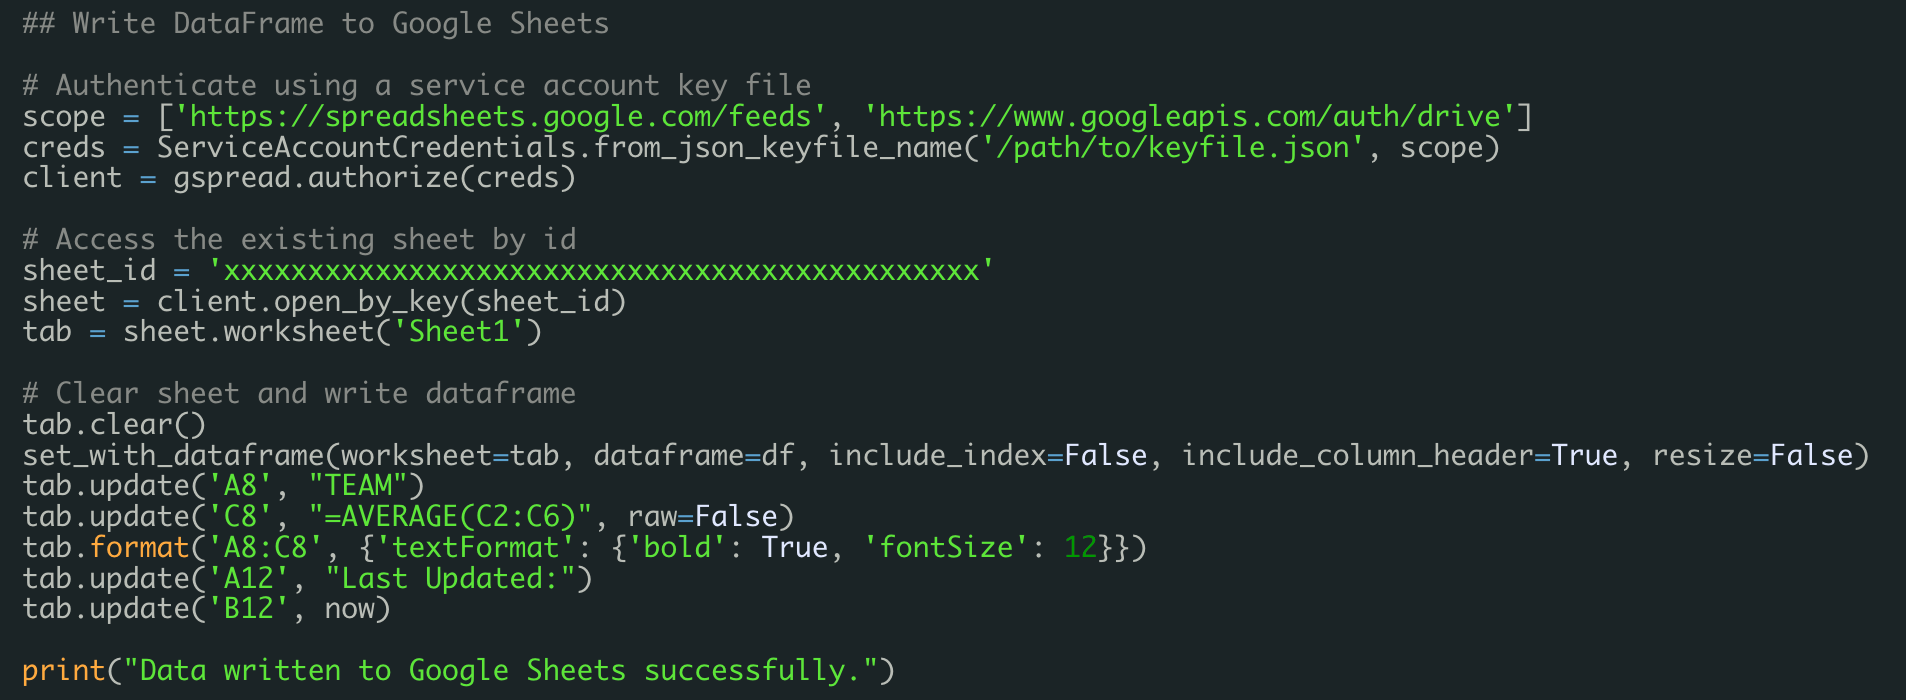
Setting up Google Sheets API access appropriately is beyond the scope of this article. That being said, I recommend setting up OAuth access to discrete services separately, properly securing your access tokens so that others cannot gain unapproved access to them, and following instructions for how and where you allow access to edit documents using the API.
To facilitate this script being able to write to a Google Sheet, I chose to leverage the gspread, gspread_dataframe, and oauth2client.service_account Python modules. I do not care about persisting data previously written to the Google Sheet, and, after each successful writing of new data, I want to post a timestamp to let any viewer of the sheet know when the data was last updated, and to provide myself with a very helpful indication of whether or not the script is continuing to run properly. The code for all of this is:
Putting It All Together
Now that we’ve automated the “dirty work” (or “busy work”) with a script, we can stop there…and simply run the script anytime we want to update our spreadsheet (or print the information for our team’s drivers to screen), but I’m lazier than that. The final step for me is to set this script to run periodically on its own so the data in my spreadsheet is always current. Most operating systems have some sort of task scheduler built-in, including MacOS (Automator), Windows (Scheduled Tasks), and Linux (cron), and those can certainly be useful to schedule various tasks however frequently you want them to run. Personally, I have chosen to leverage the Windows Subsystem for Linux, and have my script set to automatically run when that environment starts up at boot. Regardless of how you configure the schedule, you probably do not need it to run thai script more frequently than once a day; more than that is excessive, as you would be most likely to retrieve the same information over-and-over-again in any single day (unless your drivers are very active in iRacing official races).
I hope that this has inspired you to dig in a little deeper with Python, the iRacing /data API, or the Google API, as all of them can result in hours of entertainment and, ultimately, many hours of saved effort performing mundane tasks. At the very least, I hope this has been insightful and worth your time. Thanks. — Chip Witt